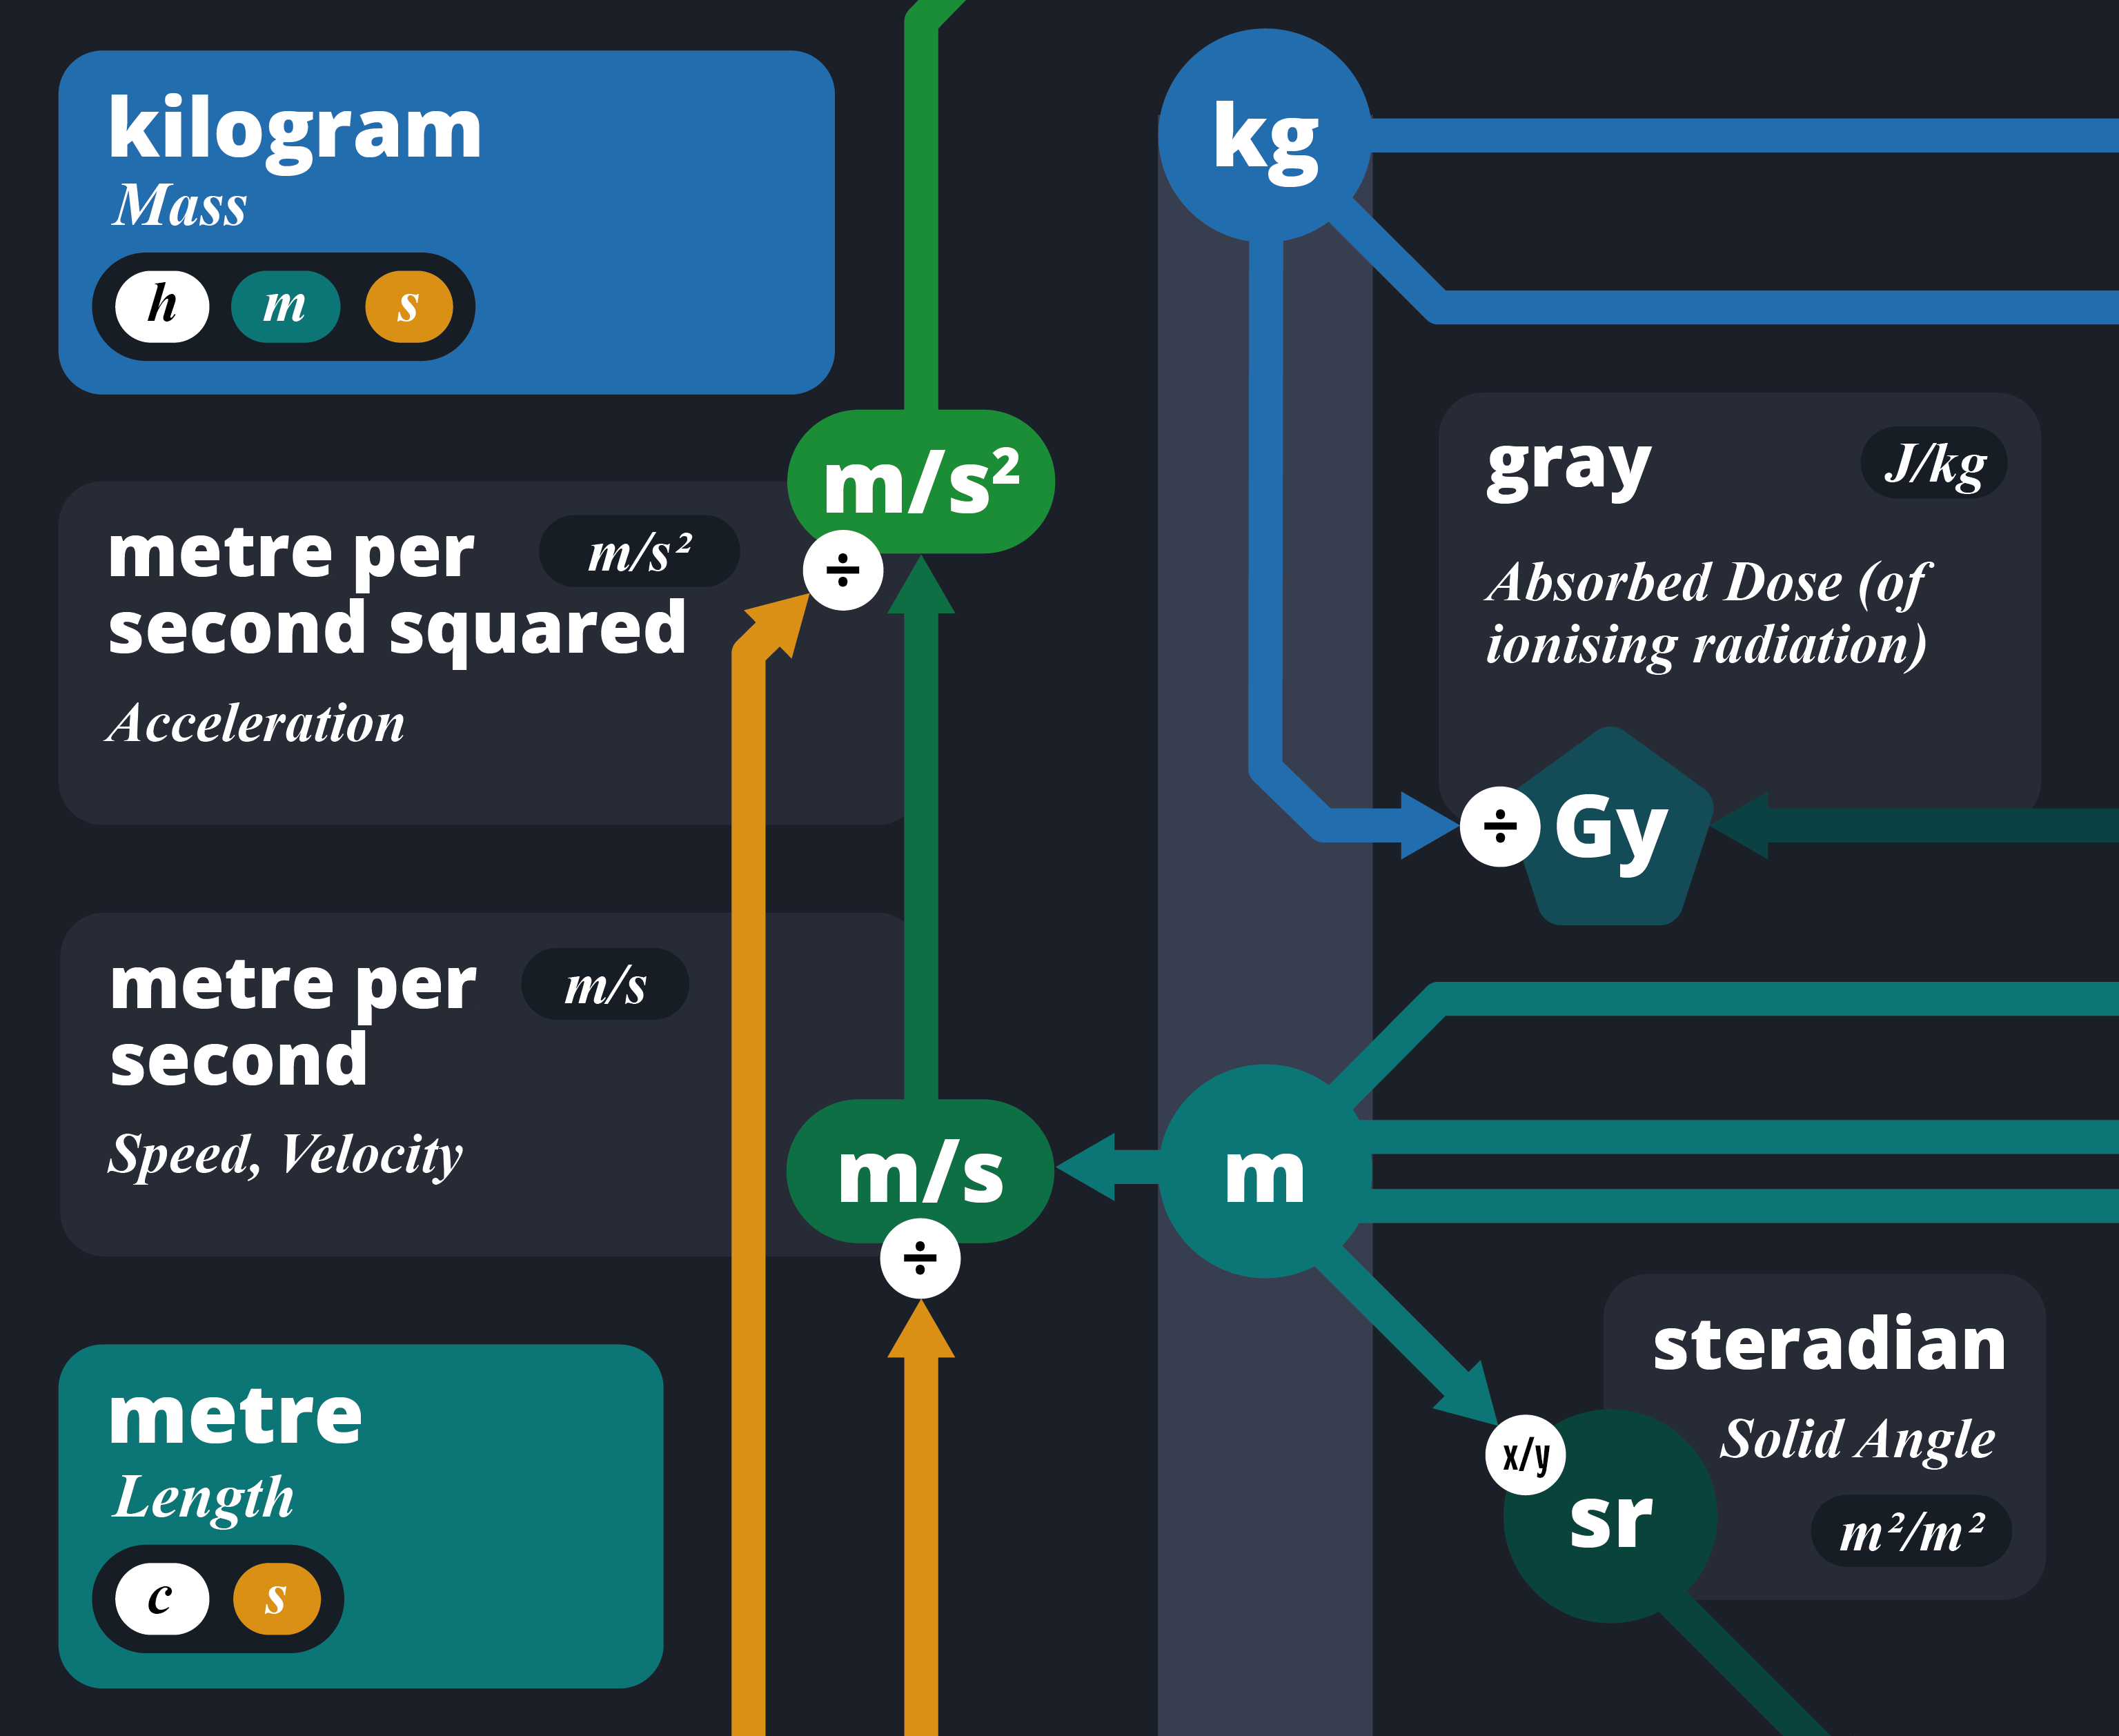
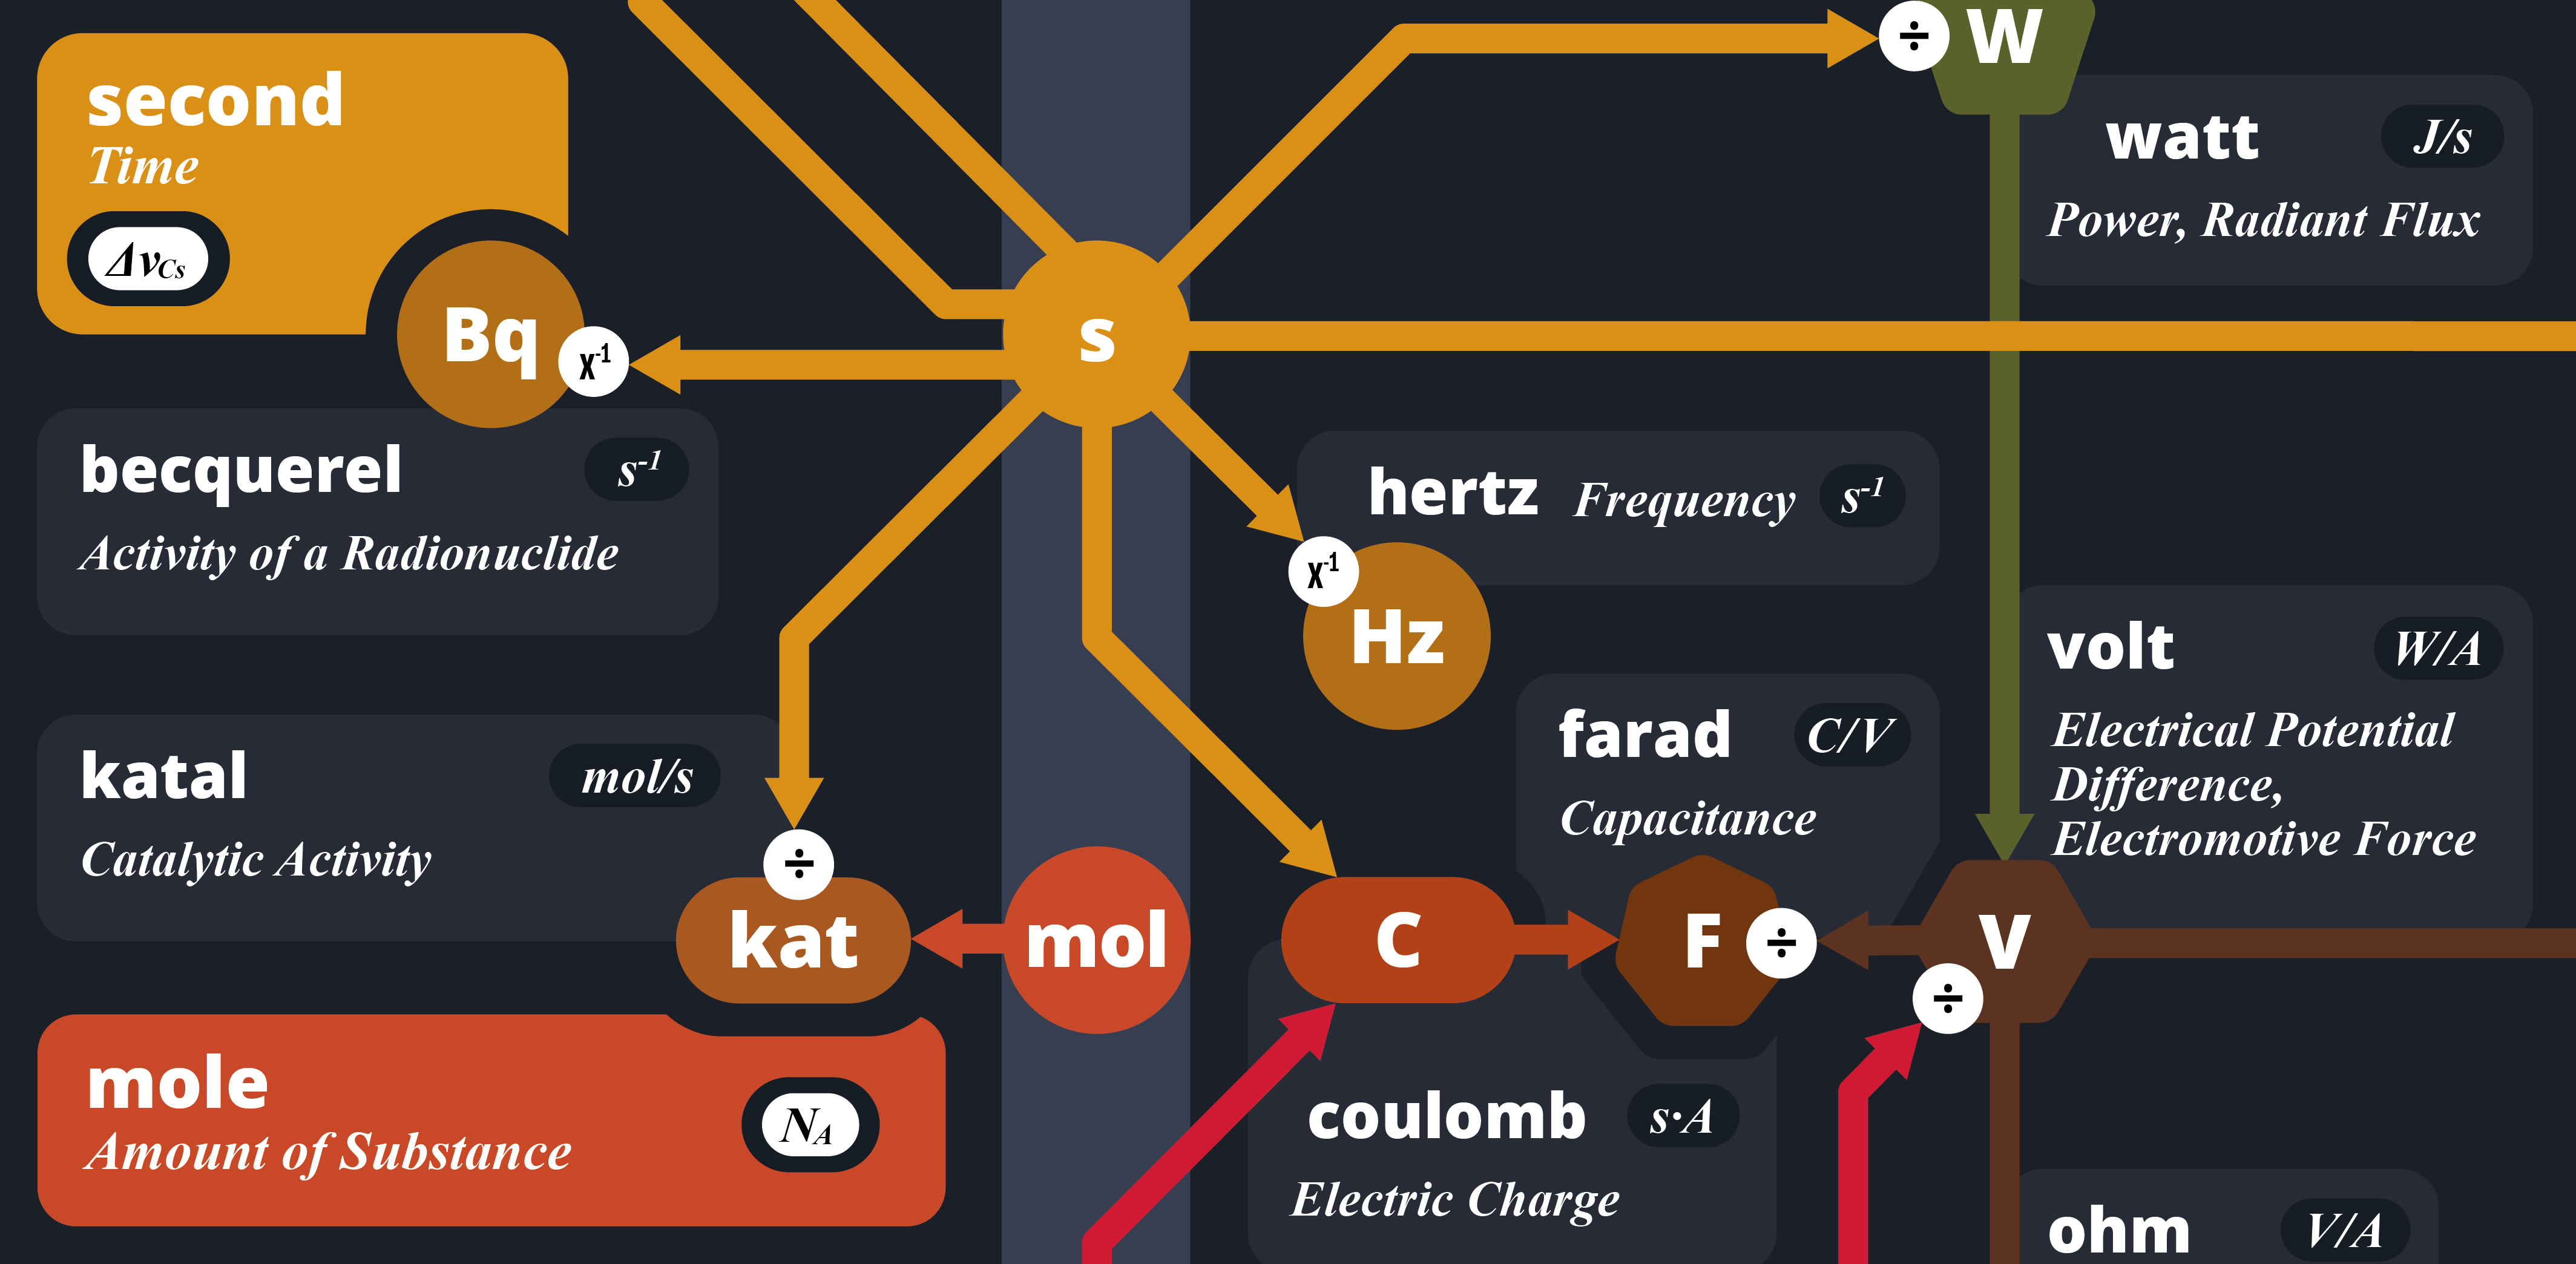
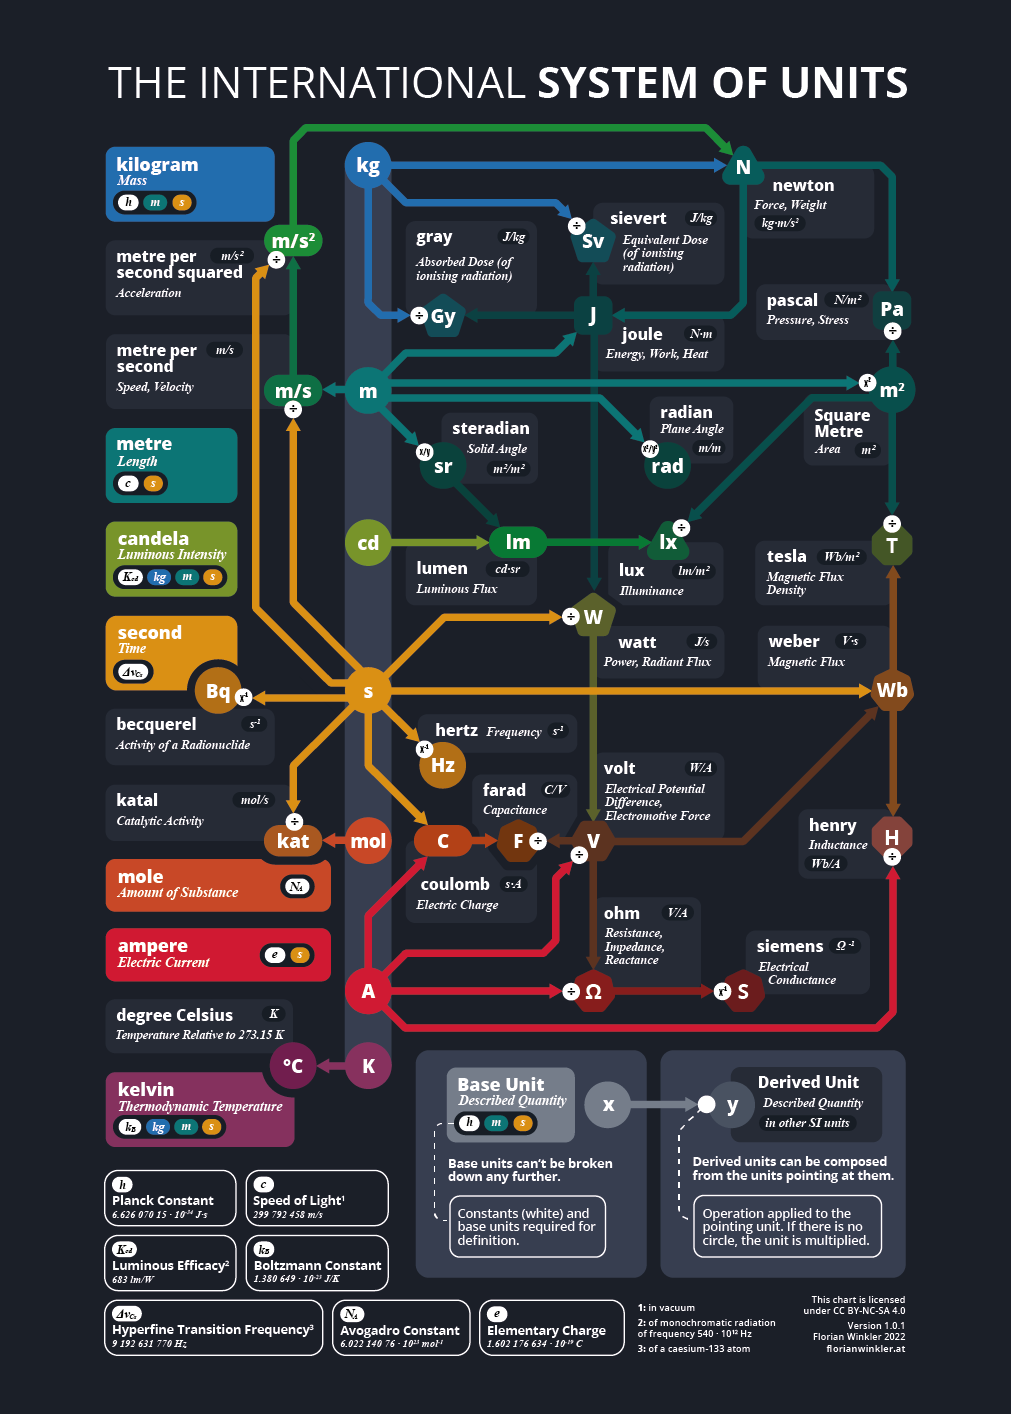
The International System of Units

In science, engineering, and everyday life, measurements matter. But how do we ensure that a kilogram in Paris is the same as a kilogram in Tokyo? The International System of Units, or SI, provides a globally consistent framework for measurement, ensuring everyone speaks the same “language” when it comes to quantifying the world.

The chart

This chart shows you the relationships of the SI units, alongside their symbols, described quantities and formulas.

The International System of Units

You can get this chart as a high quality poster here:

What’s the SI System?

The SI system (from the French Système International d’Unités) is the modern form of the metric system, established and maintained by the International Bureau of Weights and Measures (BIPM). It was officially adopted in 1960 and has evolved over time to reflect advancements in science and technology.

SI is built on a set of standard units for fundamental quantities like length, time, and mass, which can then be combined to express more complex measurements like speed, force, and energy. It’s used globally in science, industry, trade, and daily life.

Why Standardization Matters

Imagine a spacecraft navigation team using kilometers while the engineering team calculates in miles—that’s exactly what happened with NASA’s Mars Climate Orbiter in 1999. The mismatch in units caused the spacecraft to disintegrate in the Martian atmosphere.

This example shows why having a standardized system of measurement like SI is so critical. It ensures that scientists, engineers, manufacturers, and policymakers around the world are speaking the same “measurement language.” Whether you’re building microchips in South Korea, launching rockets in the U.S., or conducting climate research in Europe, the SI system eliminates confusion and reduces costly errors.

Base Units and Derived Units

At the heart of the SI system are seven base units, each corresponding to a fundamental physical quantity:

QuantityUnit NameSymbol
Lengthmetrem
Masskilogramkg
Timeseconds
Electric currentampereA
TemperaturekelvinK
Amount of substancemolemol
Luminous intensitycandelacd

From these base units, derived units are constructed to measure more complex properties. Some have special names:

Derived QuantityUnit NameSymbolFormula
ForcenewtonNkg·m/s²
EnergyjouleJN·m
PressurepascalPaN/m²
PowerwattWJ/s
FrequencyhertzHz1/s

The Constants

A major update to the SI system came in 2019, when definitions of the base units were redefined in terms of fundamental physical constants — values believed to be universal and invariant.

Some of the key constants used in SI definitions include:

  • The speed of light (c) = 299,792,458 m/s
  • Planck’s constant (h) = 6.62607015 × 10⁻³⁴ J·s
  • The elementary charge (e) = 1.602176634 × 10⁻¹⁹ C
  • The Boltzmann constant (k) = 1.380649 × 10⁻²³ J/K
  • Avogadro’s number (Nₐ) = 6.02214076 × 10²³ mol⁻¹

You can find all the constants and their values in the boxes on the bottom left of the chart.

By anchoring unit definitions to these constants, the SI system has become more robust and less dependent on physical artifacts (like the old kilogram prototype).

The SI system is more than just a set of units—it’s a foundation for consistency in our understanding and communication of measurements. Whether you’re a scientist, engineer, student, or just someone using a thermometer or speedometer, you’re relying on the International System of Units.

Reading The Chart

This chart provides a clear, at-a-glance overview of the SI base units and the most important derived units. It visually connects the units, showing how more complex quantities are built from the fundamental ones. By following the arrows, you can trace which units are derived from which base components. The small white circle shows you what mathematical operation to apply, e.g. division. If there’s no circle, multiplication is implied.

To enhance readability, the design uses a subway map-style layout, with color shading to indicate complexity: the more derived a unit is, the more muted its color appears.

You can get this chart as a high quality poster here:

Don’t Miss My New Projects!

Get emails about my new projects, no ads or anything sketchy.

More